Go with the flow: how the brain motor system helps us process sound streams

We constantly process sounds that come in streams, embedded in a certain context — think music and speech for instance. How salient sounds standing out from a flow of auditory information are detected and processed by brain circuits was the purpose of our new study, just published in the Journal of Neuroscience. We also provide an open-access version of the manuscript, accessible to everyone.
Using brain imaging at millisecond resolution, we tracked how neural signals at multiple frequencies interact with one another, within and between brain regions, to enable this complex function. We discovered that both auditory and motor regions anticipate and process sound sequences in a network fashion, via a polyrhythmic mechanism that is impaired in people affected by amusia, which challenges their appreciation of melodic pitch changes in music.
We believe our study establishes a blueprint for further research on complex auditory percepts and related disorders.
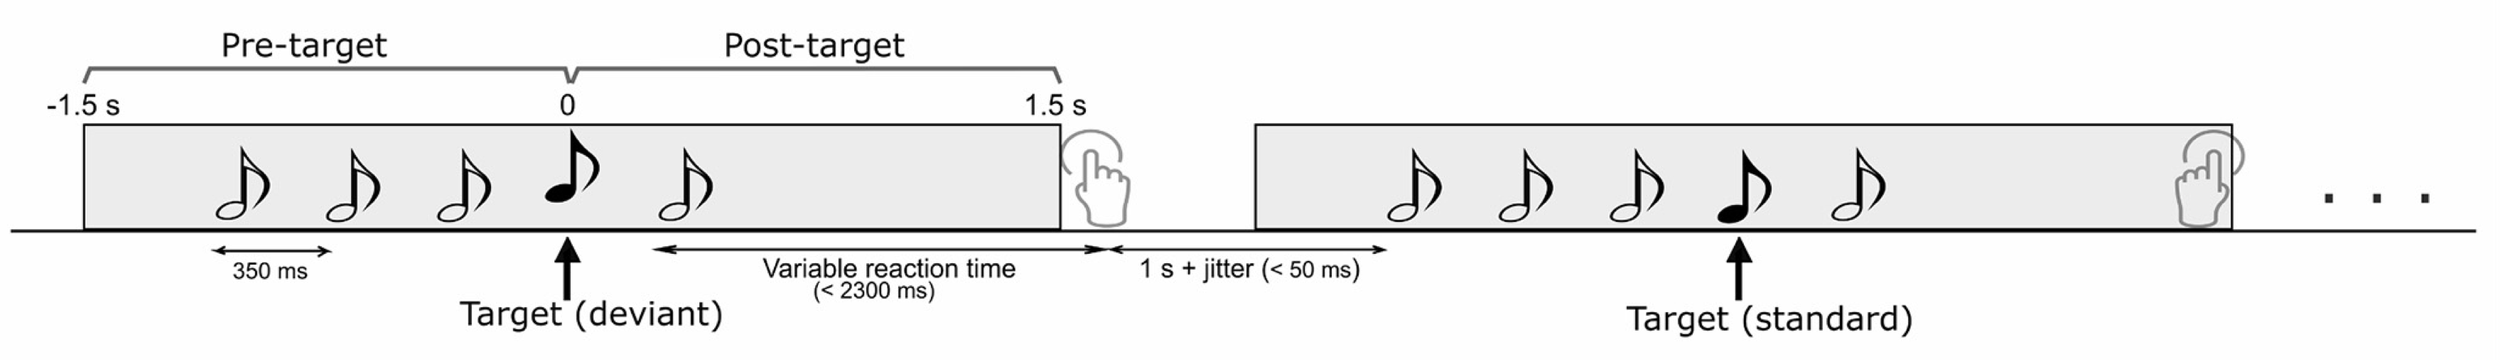
We used a relatively simple task design to test participants and record their brain activity with magnetoencephalography (MEG). They were presented with sequences of 5 pure tones, 350 ms apart from each other. The 4th tone could be a repeat of the all identical previous 3 (standard condition), or a tone with a pitch deviating slightly from the standard (deviant condition). The last tone was another standard tone.
The participants were asked to press a button to indicate whether they perceived a standard or a deviant tone inside the sequence.
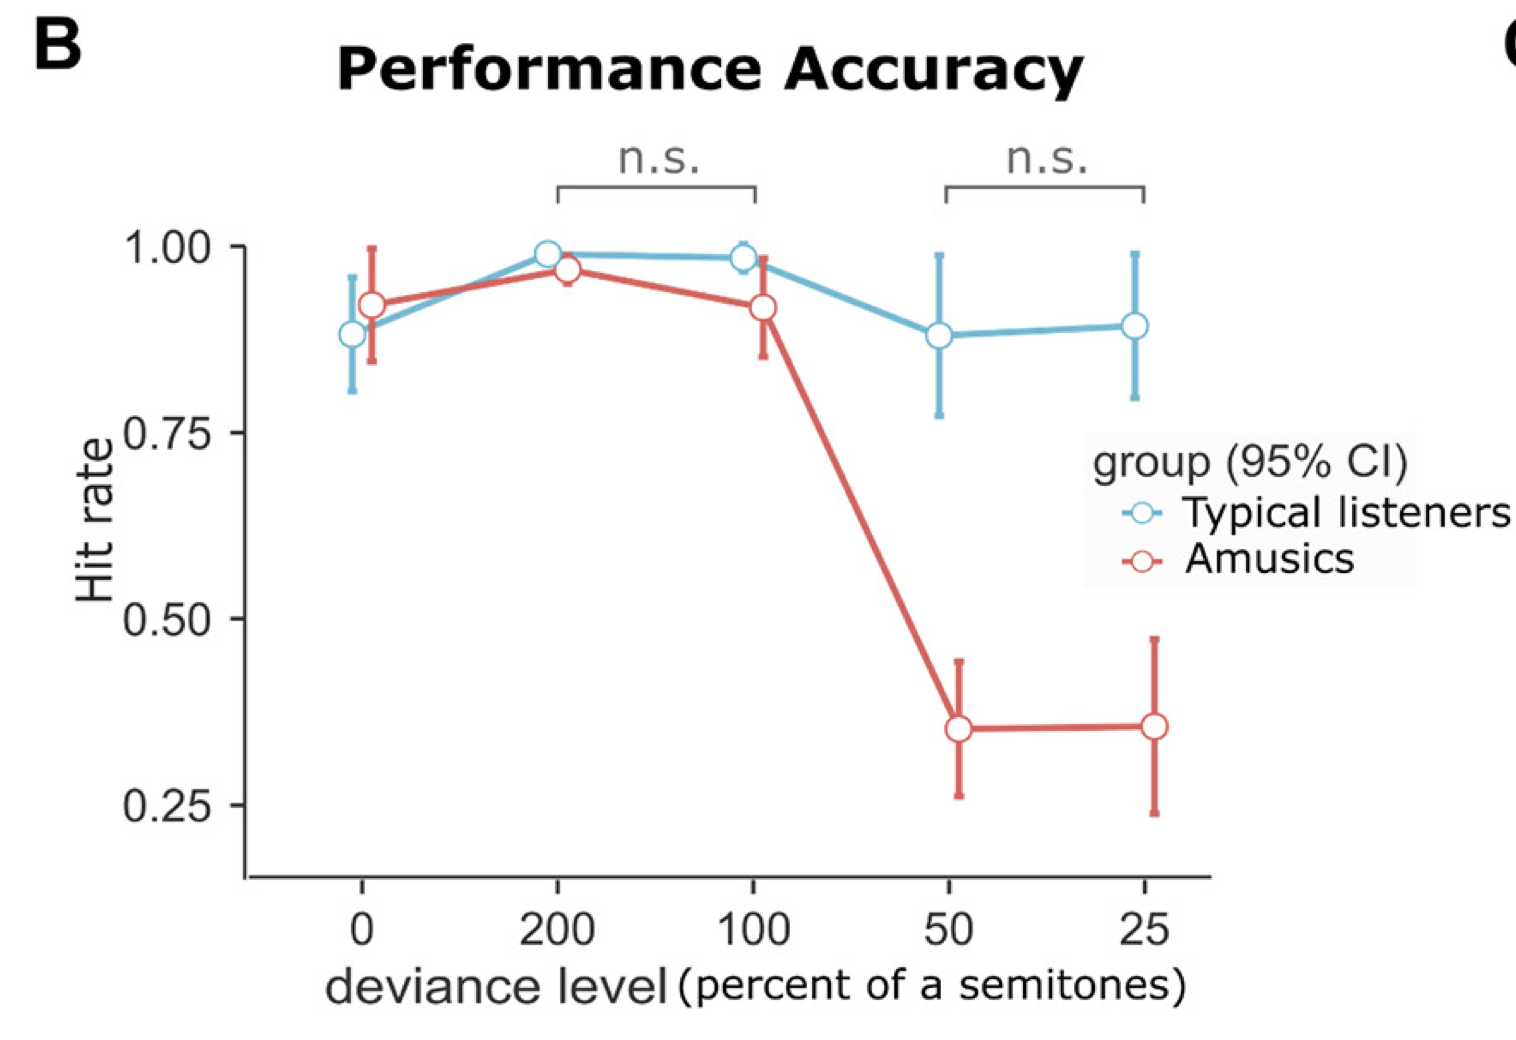
We tested two categories of participants: typical listeners with normal hearing, and amusic participants, who, despite normal hearing sensitivity, experience great difficulties perceiving melodies. Access to amusic participants, a rare syndrome, was facilitated thanks to Prof Isabelle Peretz. As expected, the amusic participants were challenged by the detection of the deviant tone, as shown in the following figure:
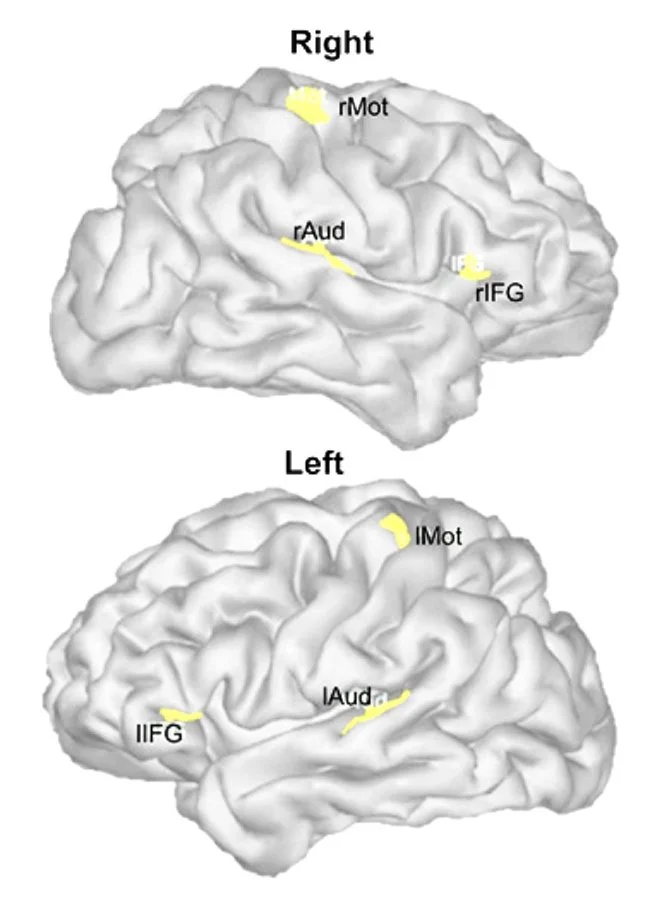
We then proceeded to map the participants’ brain activity using imaging techniques we have developed over the years. We focussed our analyses on three regions of interest in each brain hemisphere. We chose these regions because of their known involvement in auditory processes (primary auditory cortex, inferior frontal cortex), and motor areas.
To look into motor brain regions to understand how we perceive sound sequences may seem counterintuitive. However, we know from our previous research, and many others, that the “action brain” is involved in sensory perception, even when we remain completely still. There are many theoretical reasons why this may be, but simply put, sensory processing may be seen as an active process, whereby the brain anticipates and explores all possible sources of external information in a given context. We can move our eyes and our hands for sensory explorations; we also move our tongue to better appreciate new food. Sure enough, we cannot move our ears (other species can), but we can move our heads, to better orient our auditory attention!
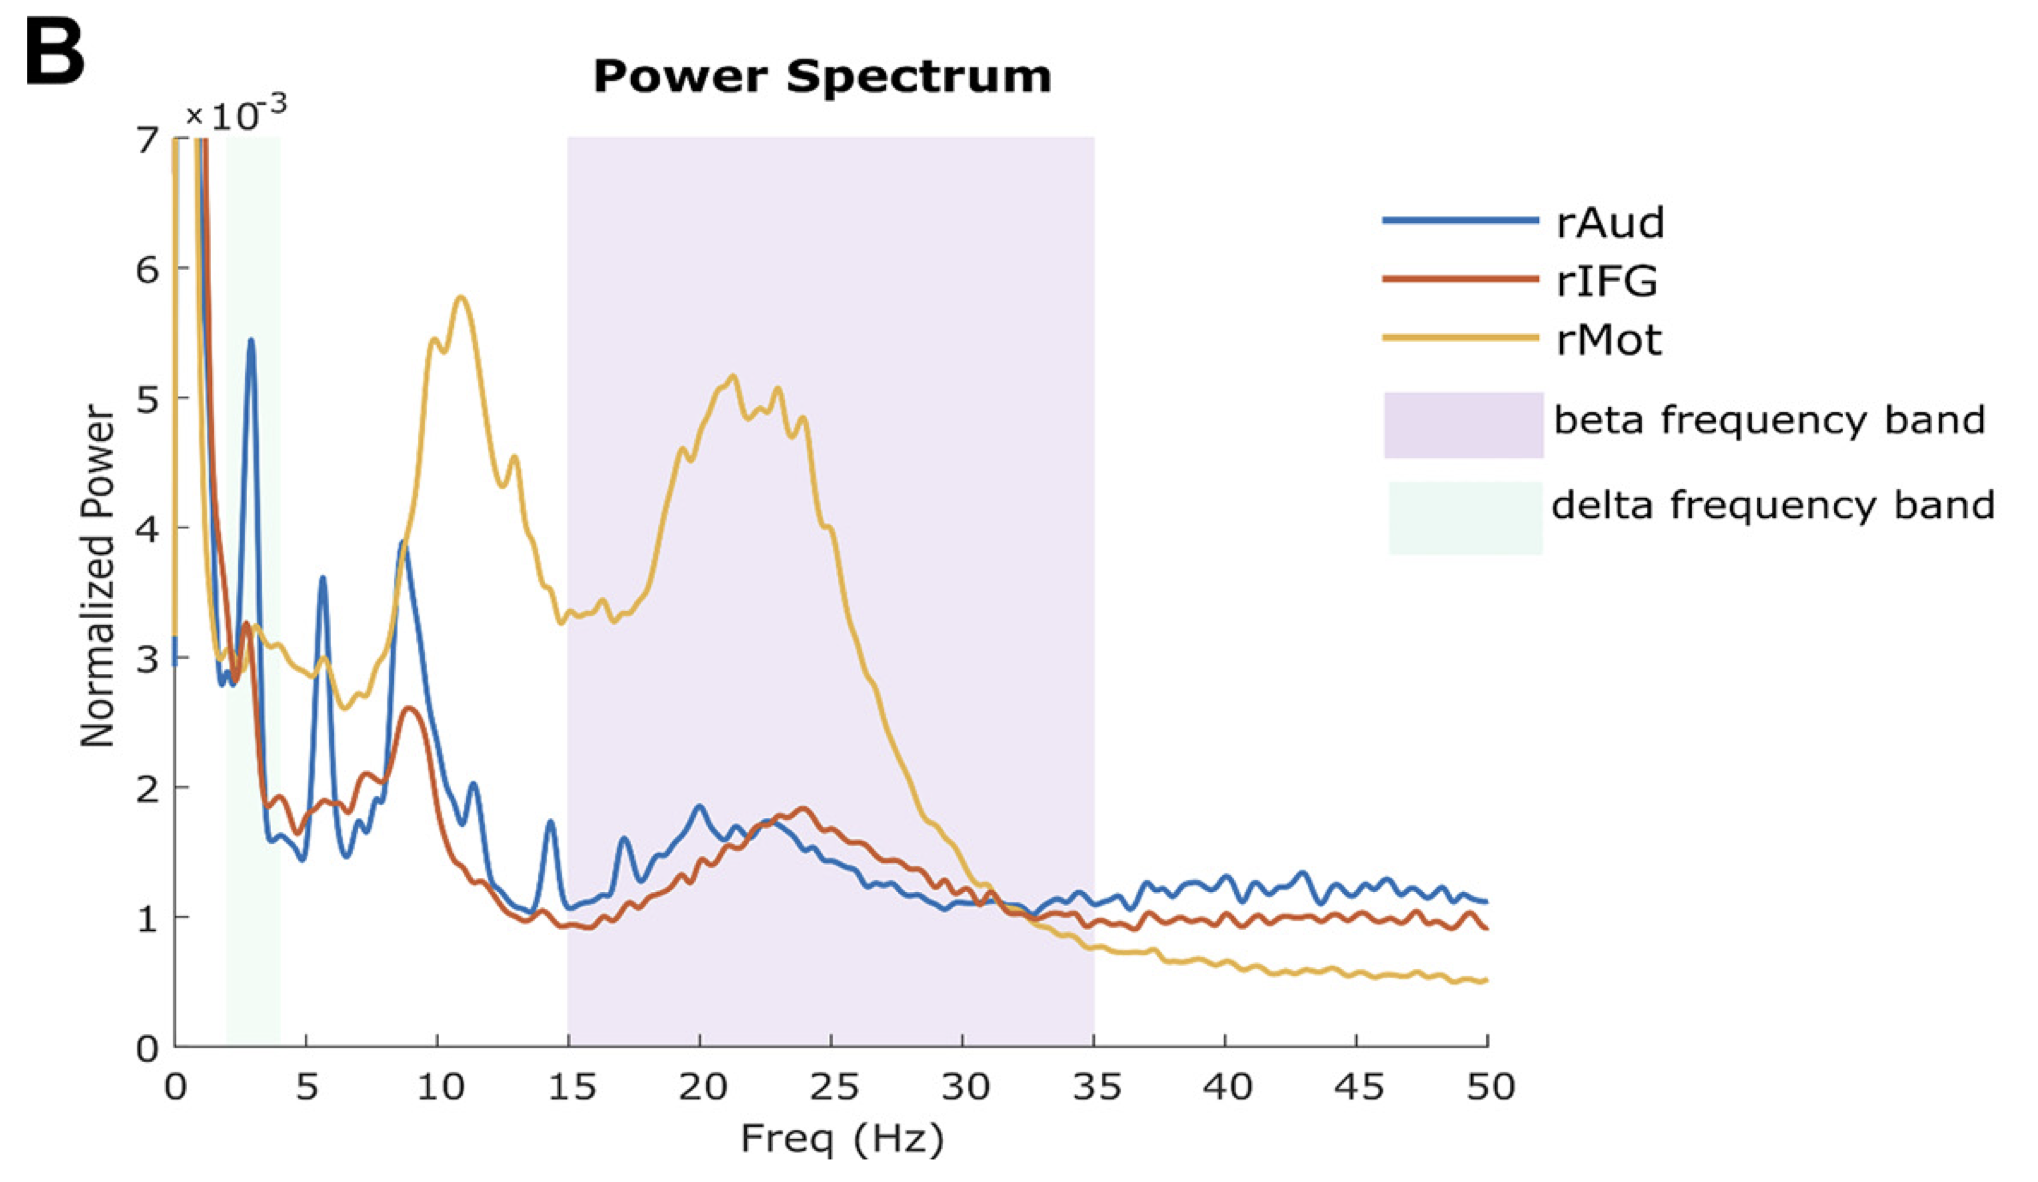
Looking into the contents of brain activity in these regions, we found a wealth of signals expressed at different frequencies, from very slow (in the auditory cortex, in blue below), to much faster (in the motor cortex, in orange). These different signal components convey how the brain processes external acoustic information, in combination with its own internal representations of these auditory inputs, the task demands, and the mental state of the participant at the moment of the study.
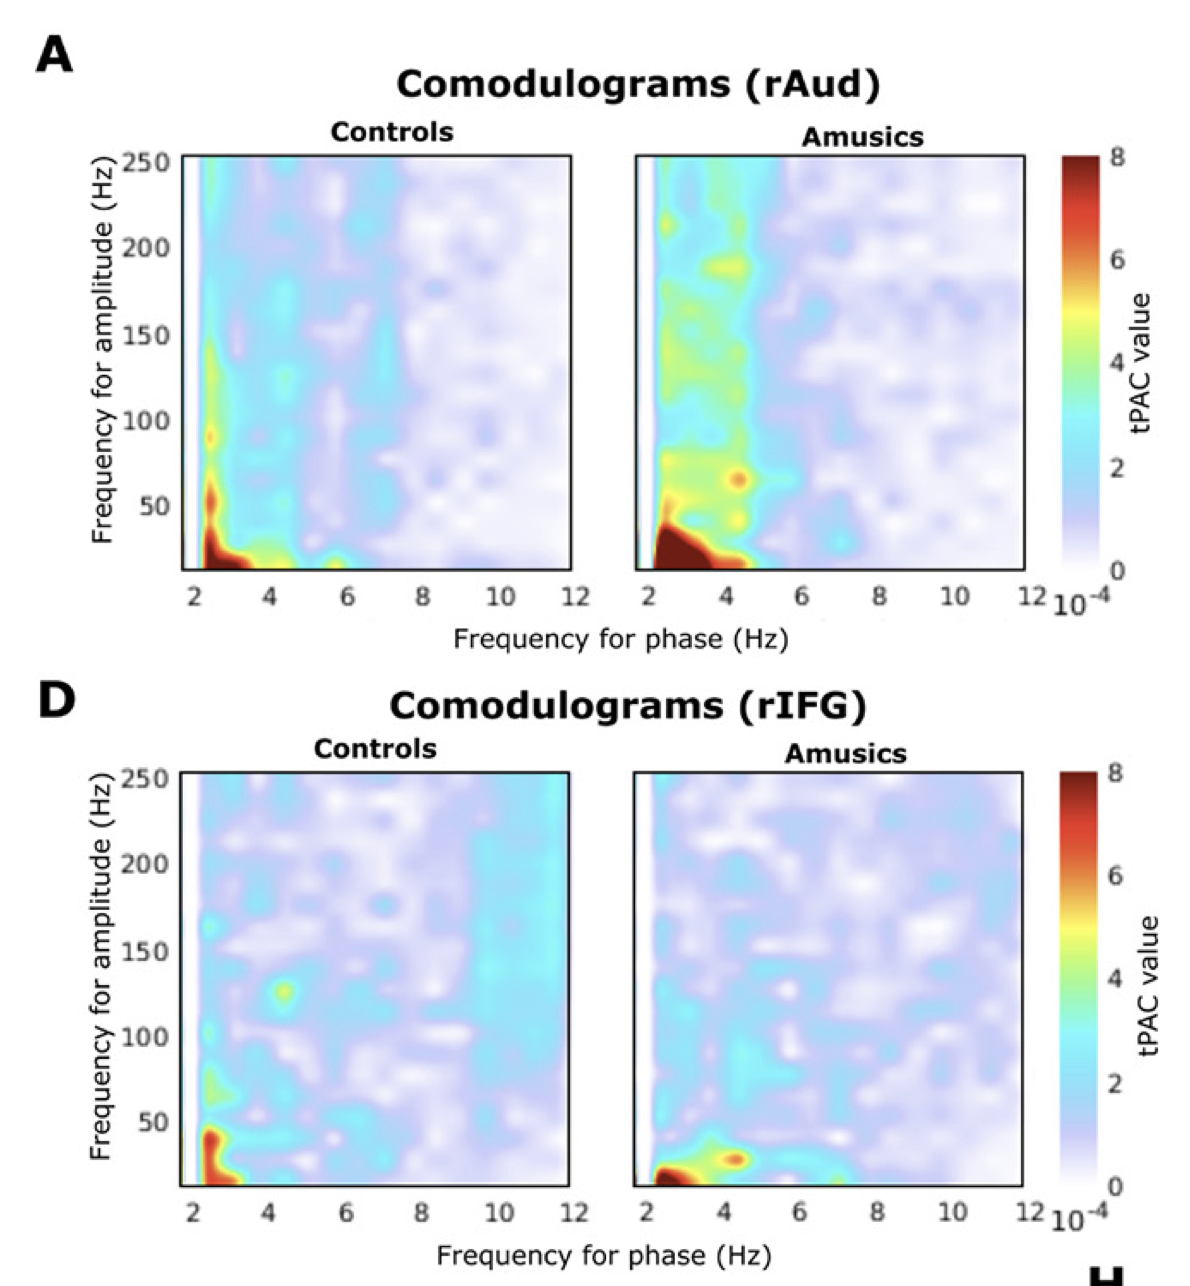
In fact, these polyrhythmic signals are interdependent: short, rapid bursts of fast signals ride on top of cycles of slower activity. This is a well-studied phenomenon known as cross-frequency phase-amplitude coupling (PAC). We showed in a previous study that the fast bursts mark certain moments in time when the brain expects sensory inputs to occur. In the present data, we did find again expressions of PAC, especially in motor regions and the lateral, inferior aspect of the frontal lobe.
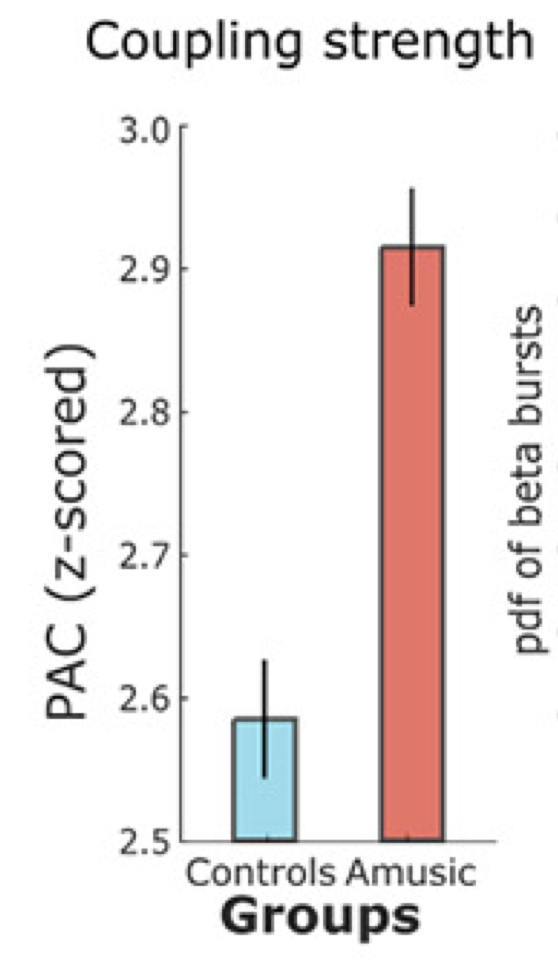
Quite remarkably, we found that this coupling was significantly stronger in amusic participants than in controls.
We therefore decided to look into this effect more closely, as we thought that this increased coupling may explain, at least in part, the difficulties experienced by amusic participants in detecting the acoustic changes in the sound stream.
We therefore looked at when the coupling between slow neural oscillations in the auditory cortex, and faster oscillations issued by the motor cortex, was the strongest along the sound sequence. The reason why we thought these two components would be coupled is because the slow oscillations are essentially entrained at the pace of the sound sequence (one neural cycle per tone presentation, every 350 ms), and the faster bursts would signal “top-down brain commands” issued by the motor cortex, which tells the auditory regions when to expect an important acoustic input. Remember how we framed the study as the investigation of the brain as an active predictive machine of sensory events.
So we used a method developed in the lab by primary author Soheila Samiee, which is capable of detecting changes of cross-frequency coupling over short period of times in neural time series. What we found was quite remarkable (we think):
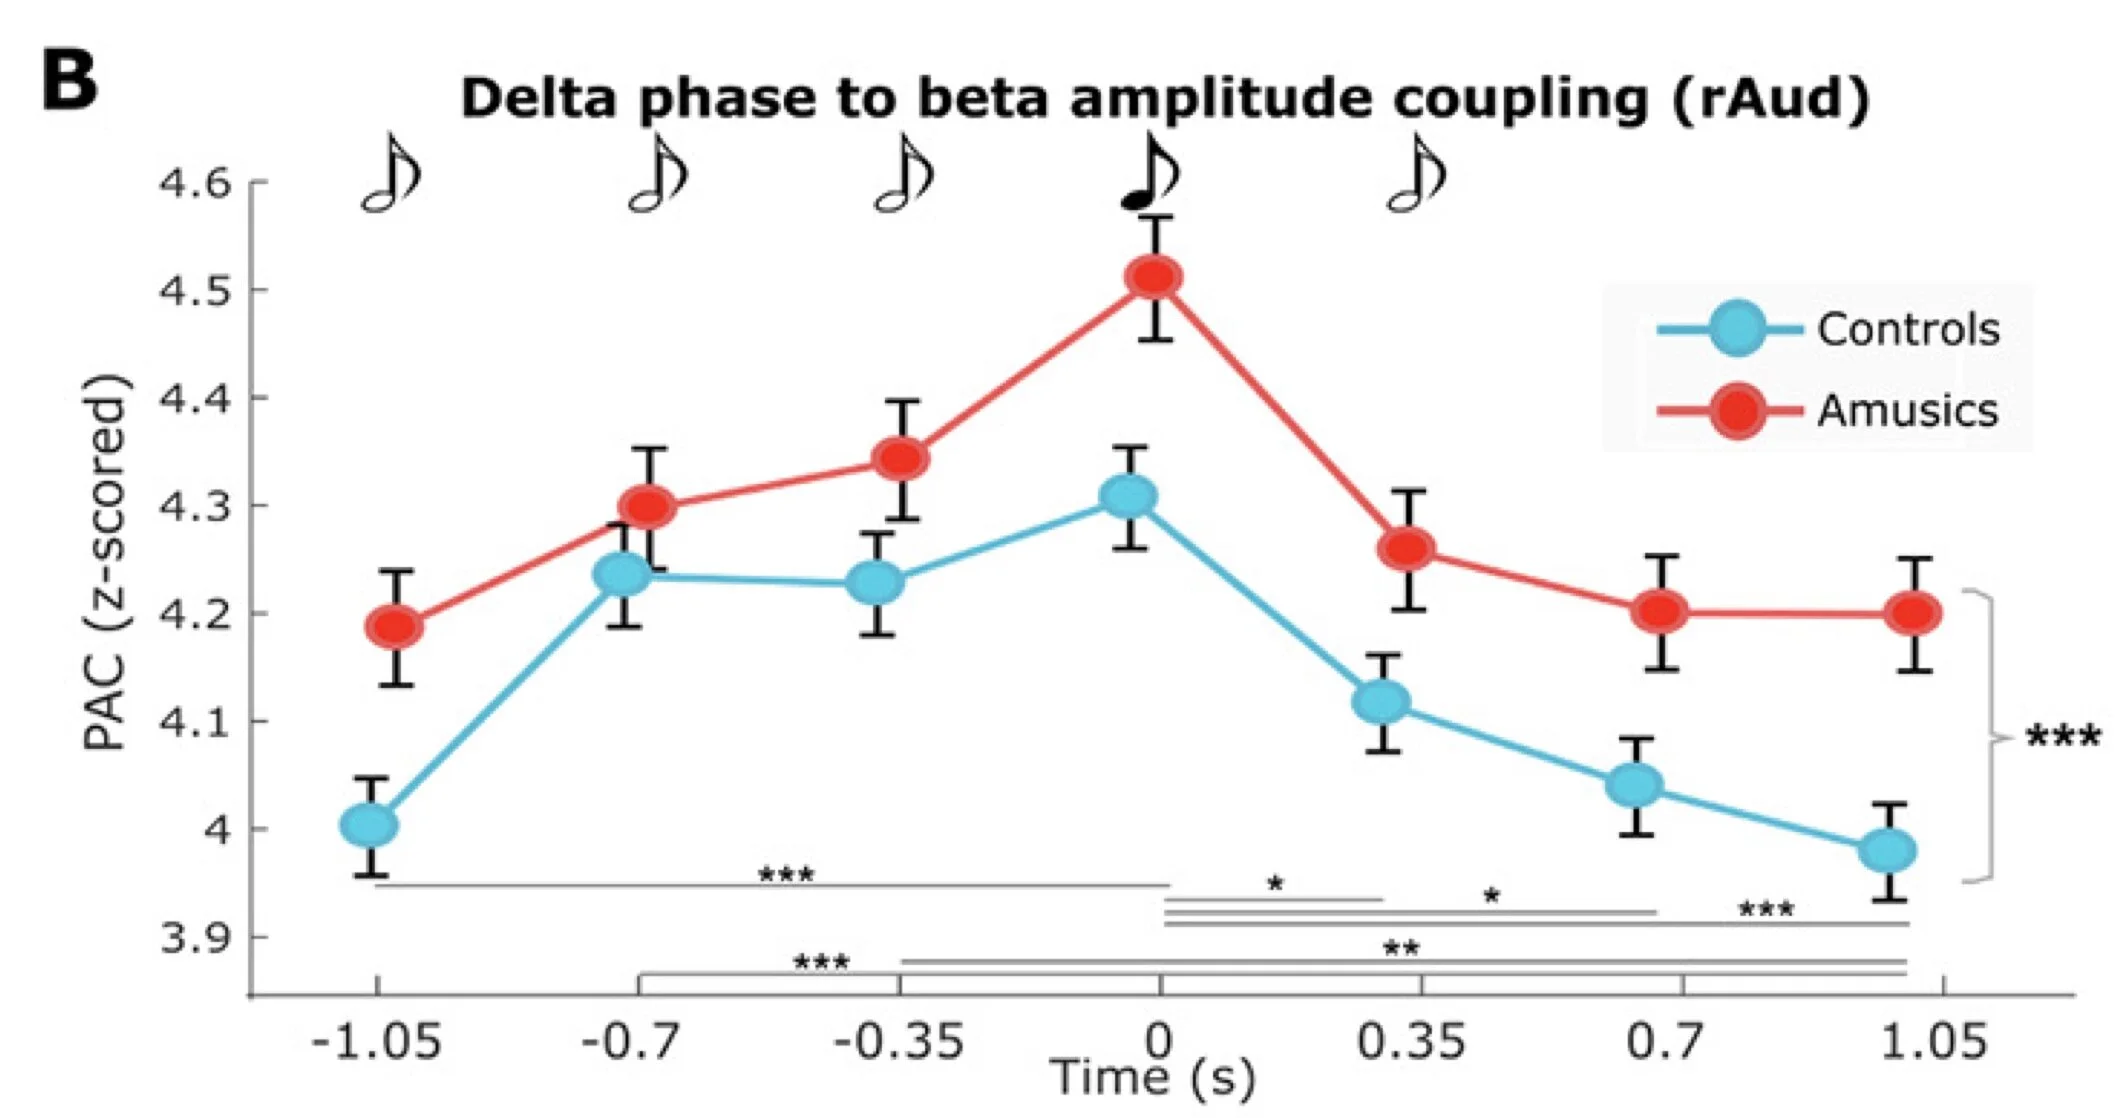
The graph above shows how cross-frequency phase-amplitude coupling varies moment to moment over the presentation of the sound sequence (see black and white notes on top). The blue line shows that PAC increases as we get closer and closer to the presentation of the target note (4th in the sequence), peaks at the moment of its presentation, and then decreases back to baseline levels. Overall, the same profile is observed in amusic participants (red line), but the levels are systematically above those observed in controls (blue line).
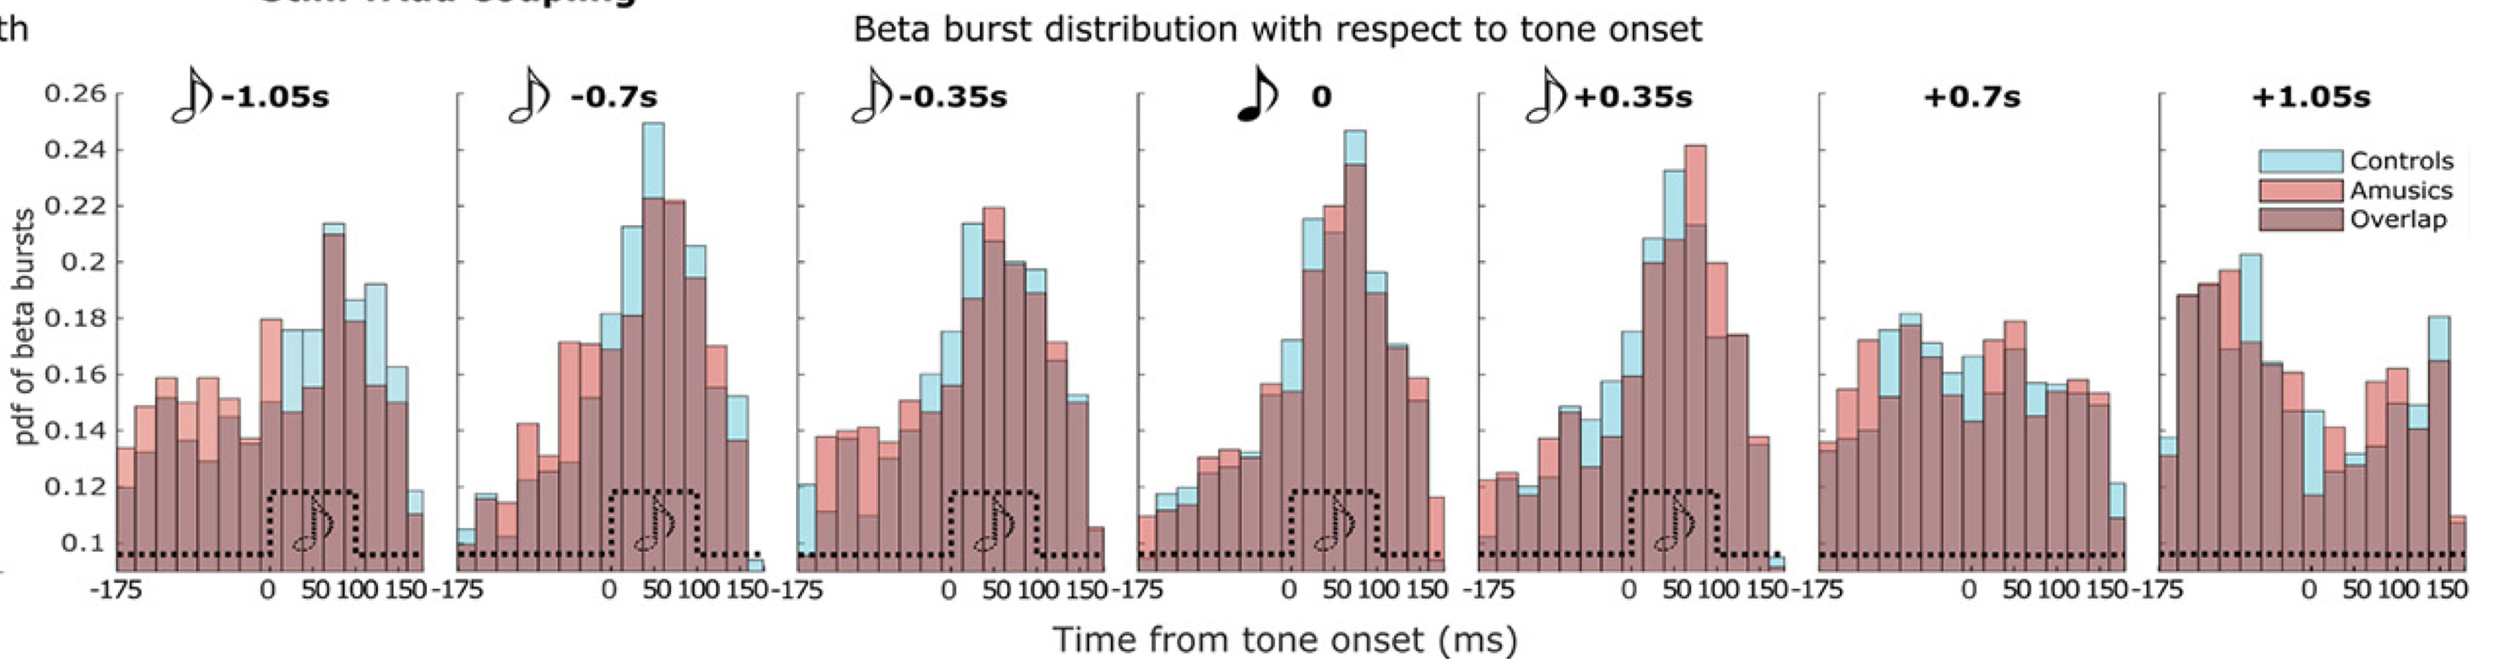
The following histograms generated from single trial data, show the same effect in a different manner: we can better appreciate that the motor fast bursts occur more and more precisely in time and consistency along the cycle of the underlying slow oscillation, as the sound stream is being presented, and especially right at the moment when the expected target sound occurs in the sequence — this is best represented by the peaky histogram in the 4th vignette below, which corresponds to moment of the presentation of the target tone.
Another potent aspect of MEG imaging is its ability to measure active connections between brain regions, meaning how similar their respective activities are, or whether one region tends to drive another. This is a subfield of neuroimaging and brain science called connectomics.
We found that these connections were stronger between regions of the right hemisphere, which is the half of the brain more involved in processing music for instance, in most individuals.
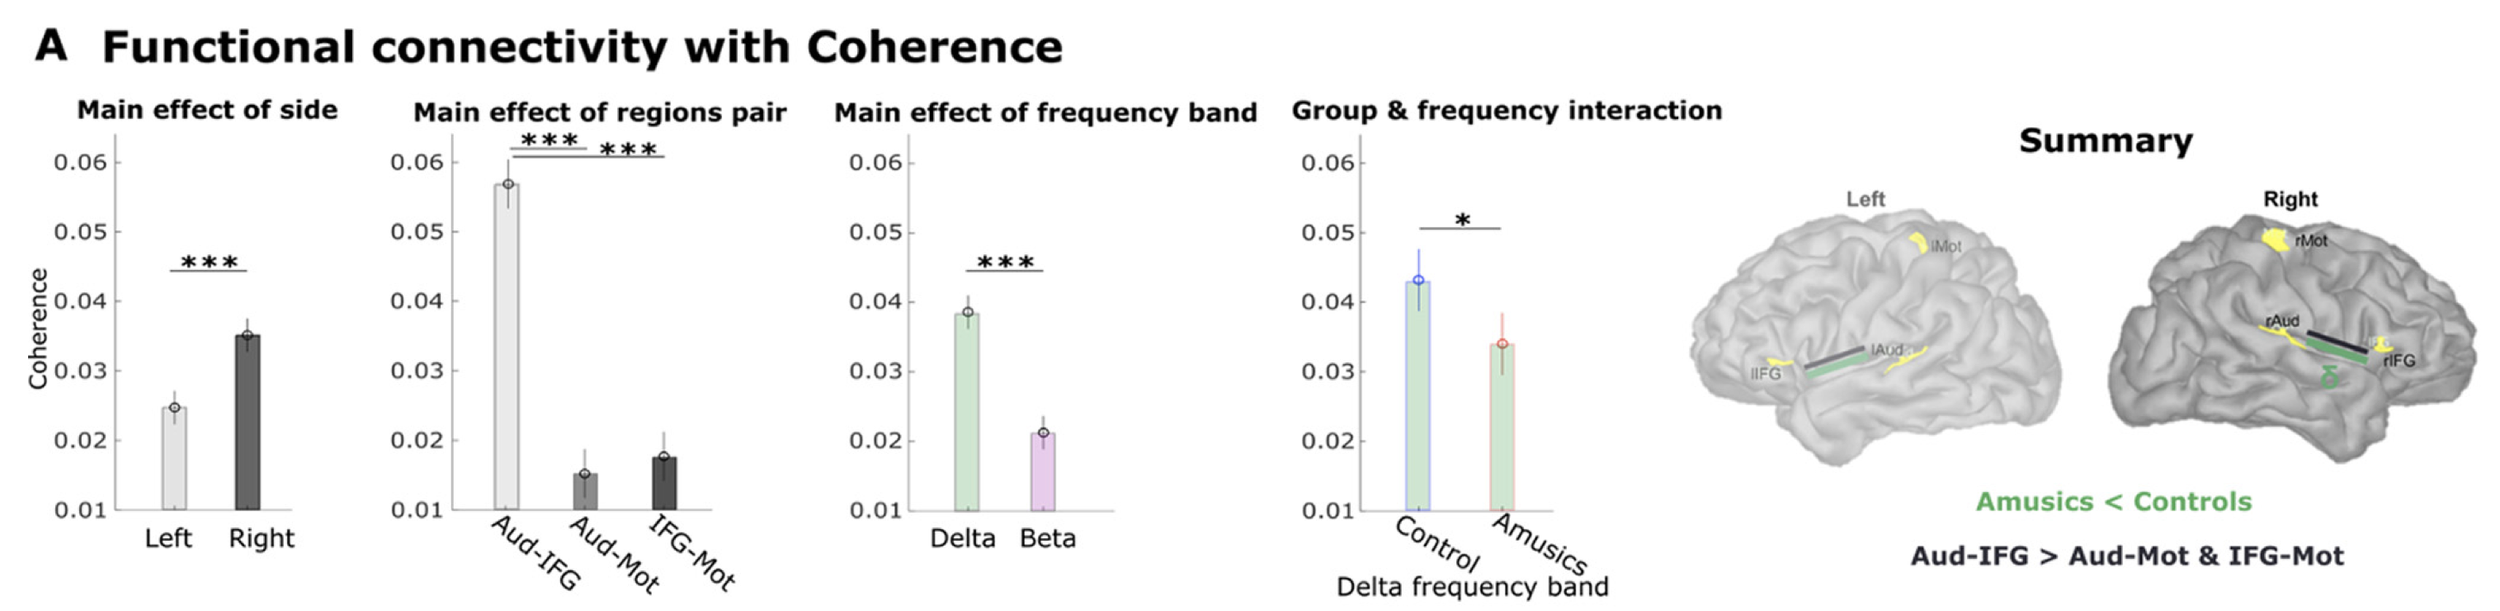
We also found that the coupling of low frequency activity was stronger in controls than in amusic participants, and very strong between the right auditory cortex and downstream, the right inferior frontal cortex.
We then measured statistical fluctuations of brain signals that reveal how certain brain regions drive some others; this is called directed functional connectivity. We found that the slow connectivity signals shown above were indeed directed from the auditory cortex towards the motor and inferior frontal regions. These connections were not as strong in amusic participants, which may indicate altered patterns of bottom-up signaling in this condition, meaning that the amusic brain does not transfer the auditory information entirely, from auditory regions to other brain areas.

We also found that the active signals issued by the motor cortex towards the auditory and inferior frontal cortex were intact in amusic participants (magenta arrows above), including during the task-free resting state of the brain. This confirms that the perceptual challenge of amusia may be caused by some malfunction of the registration of acoustic sequences, because of too much rigidity in the temporal predictions of expected acoustic inputs and/or poorer communication between the auditory cortex and higher-order regions.
Together, we believe these findings advance the complete and dynamic view of tone sequence sensory processing in audition. We anticipate that some of these new observations would generalize to other sensory modalities such as vision and touch, and that the cross- and poly-frequency neurophysiological markers of impaired auditory processing would be pertinent to other functional deficits in sensory perception.